Weekly Signal · · 14 min read
The SaaS Litmus Test: Is The March Bottom Real?
The SaaS Litmus Test: Is The March Bottom Real?
Anthropic launched Claude Design on Friday. Five trading days will tell us whether the most-attacked names in software hold their March bottom — or whether the bounce was a reflex, not a turn.
(1) Why A Special Edition This Week
Every so often the market sets up a question so specific and so cleanly answerable that running the regular nine-dimensional scorecard would bury the signal rather than surface it. This is one of those weeks. Our regular scorecard — the nine-factor, six-instrument regime monitor — returns next Sunday. For the next five trading days, almost everything worth watching is concentrated in one question.
(2) The Setup
Three threads converge into this weekend.
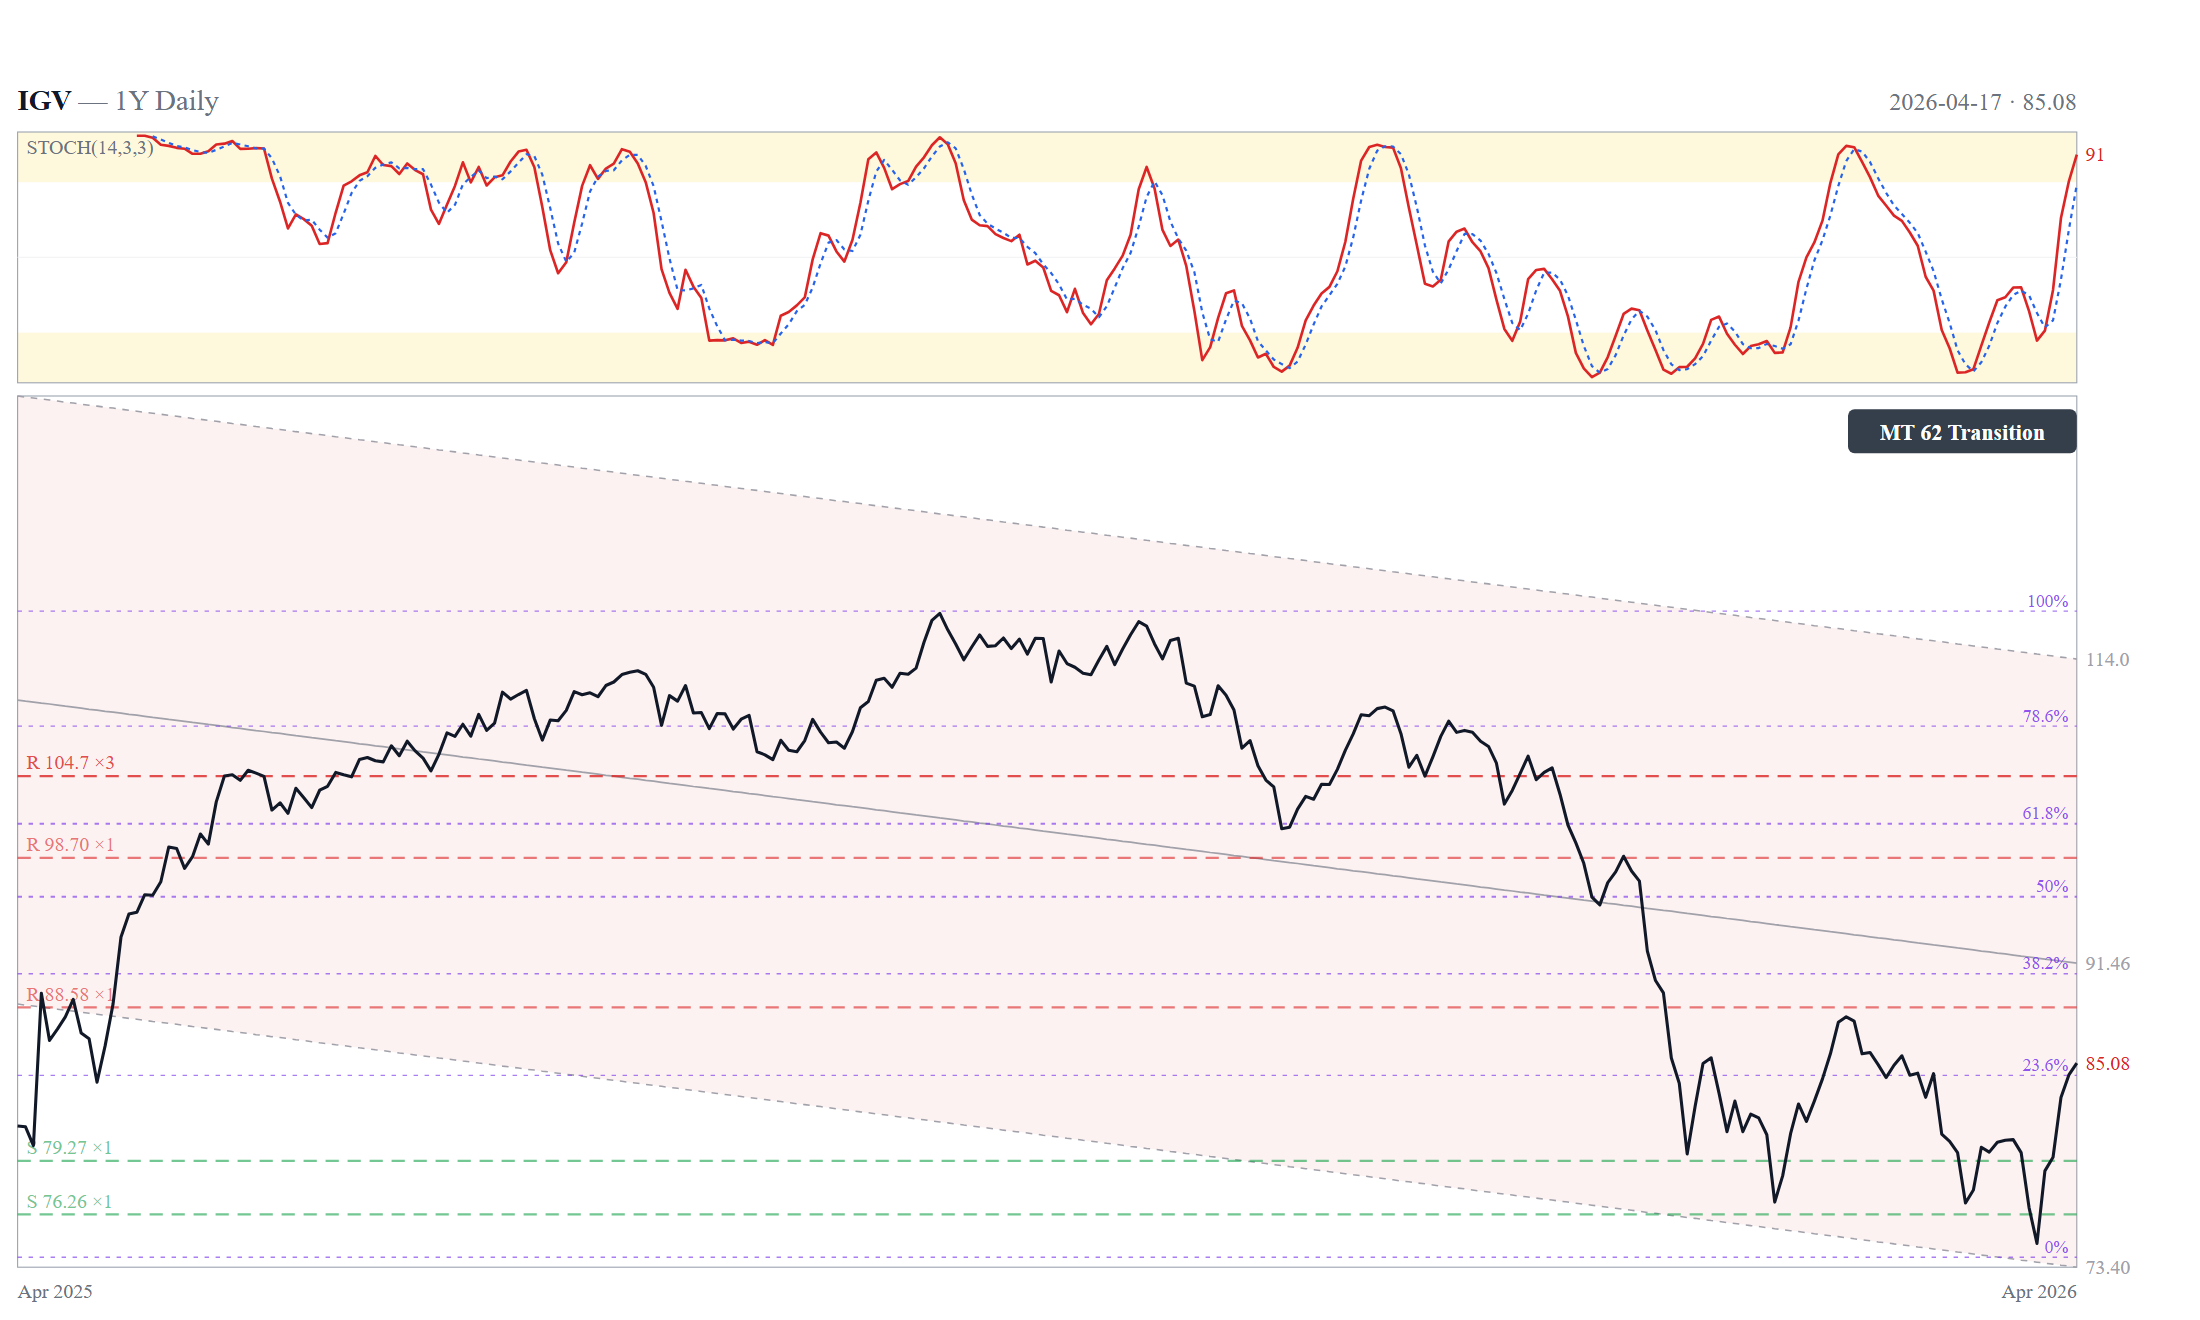
The bounce. Software and cloud names completed a textbook bottom-recovery over the past two weeks. IGV printed +13.94% for the week ending April 17, closing at $85.08 after bottoming just above its 52-week low of $73.93. CLOU +11.93%, ARKK +14.35%, CIBR +9.45% — violent moves off a completed March drawdown, with the entire March correction reversed in five trading days. Oracle led the tape with +13% in a single session on April 13. Michael Burry disclosed new software-sector longs the same week. The setup felt like classic bottom-build: weeks of selling exhaustion, then sudden absorption.
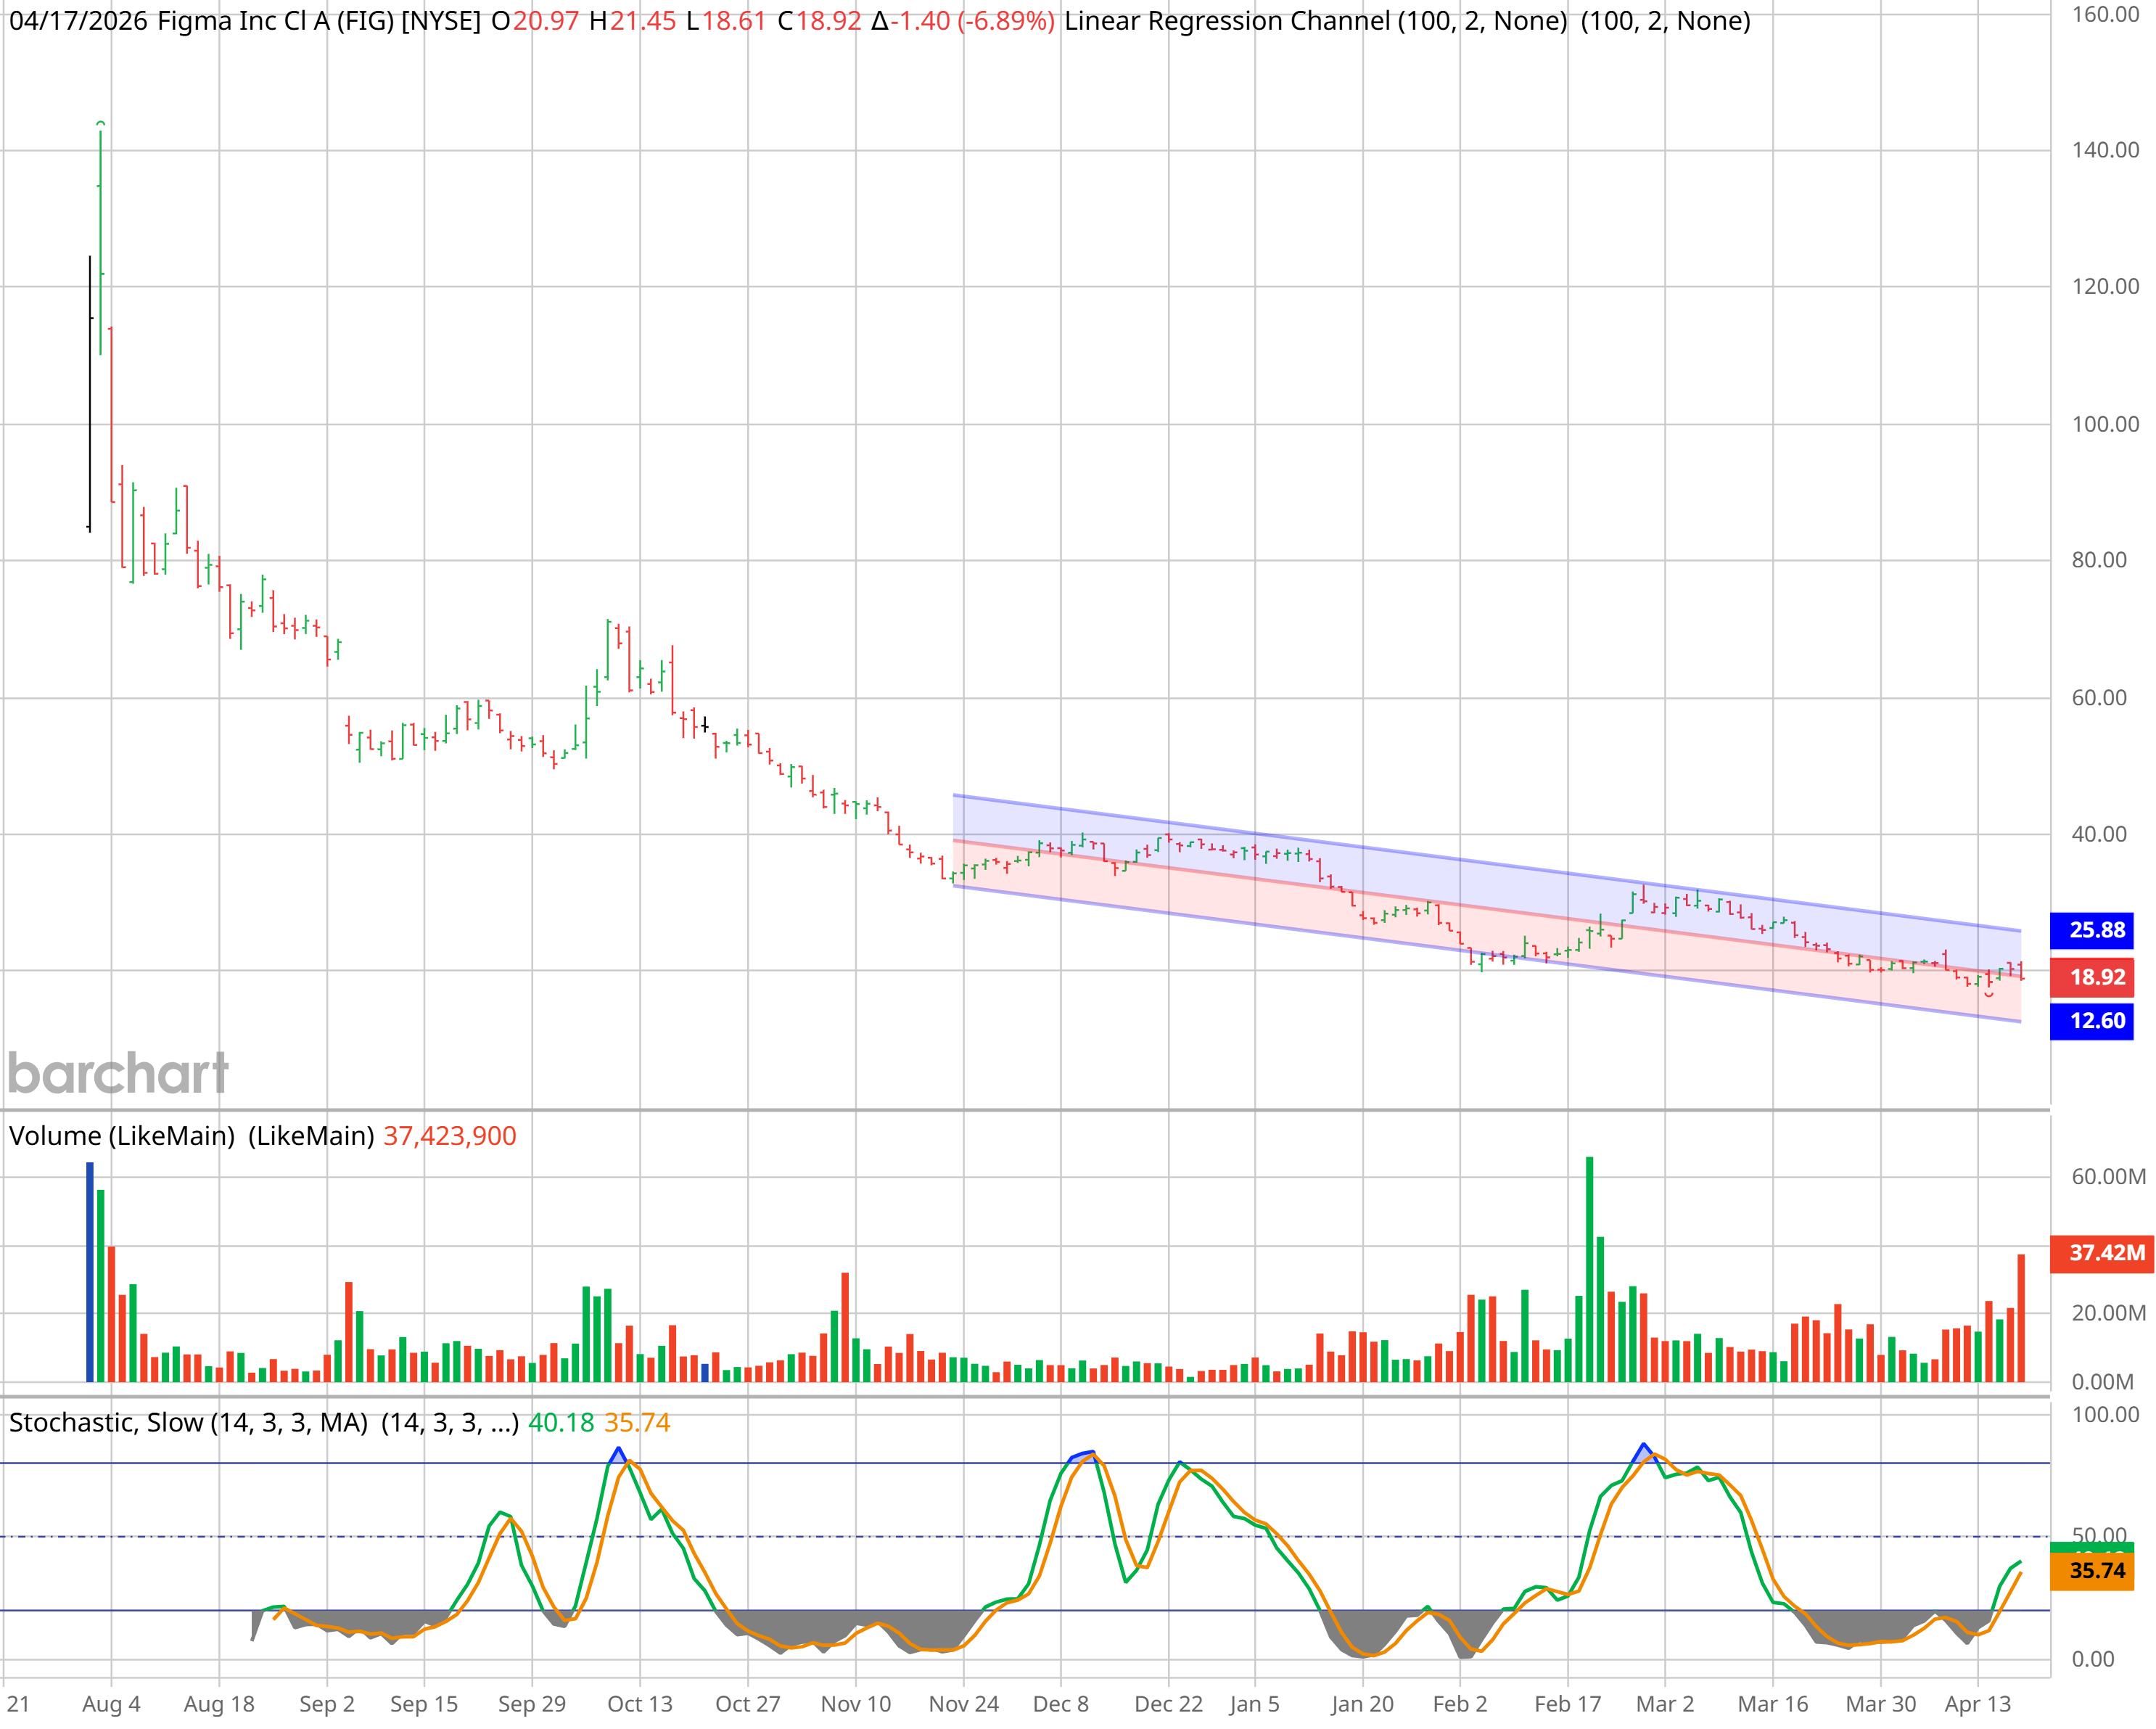
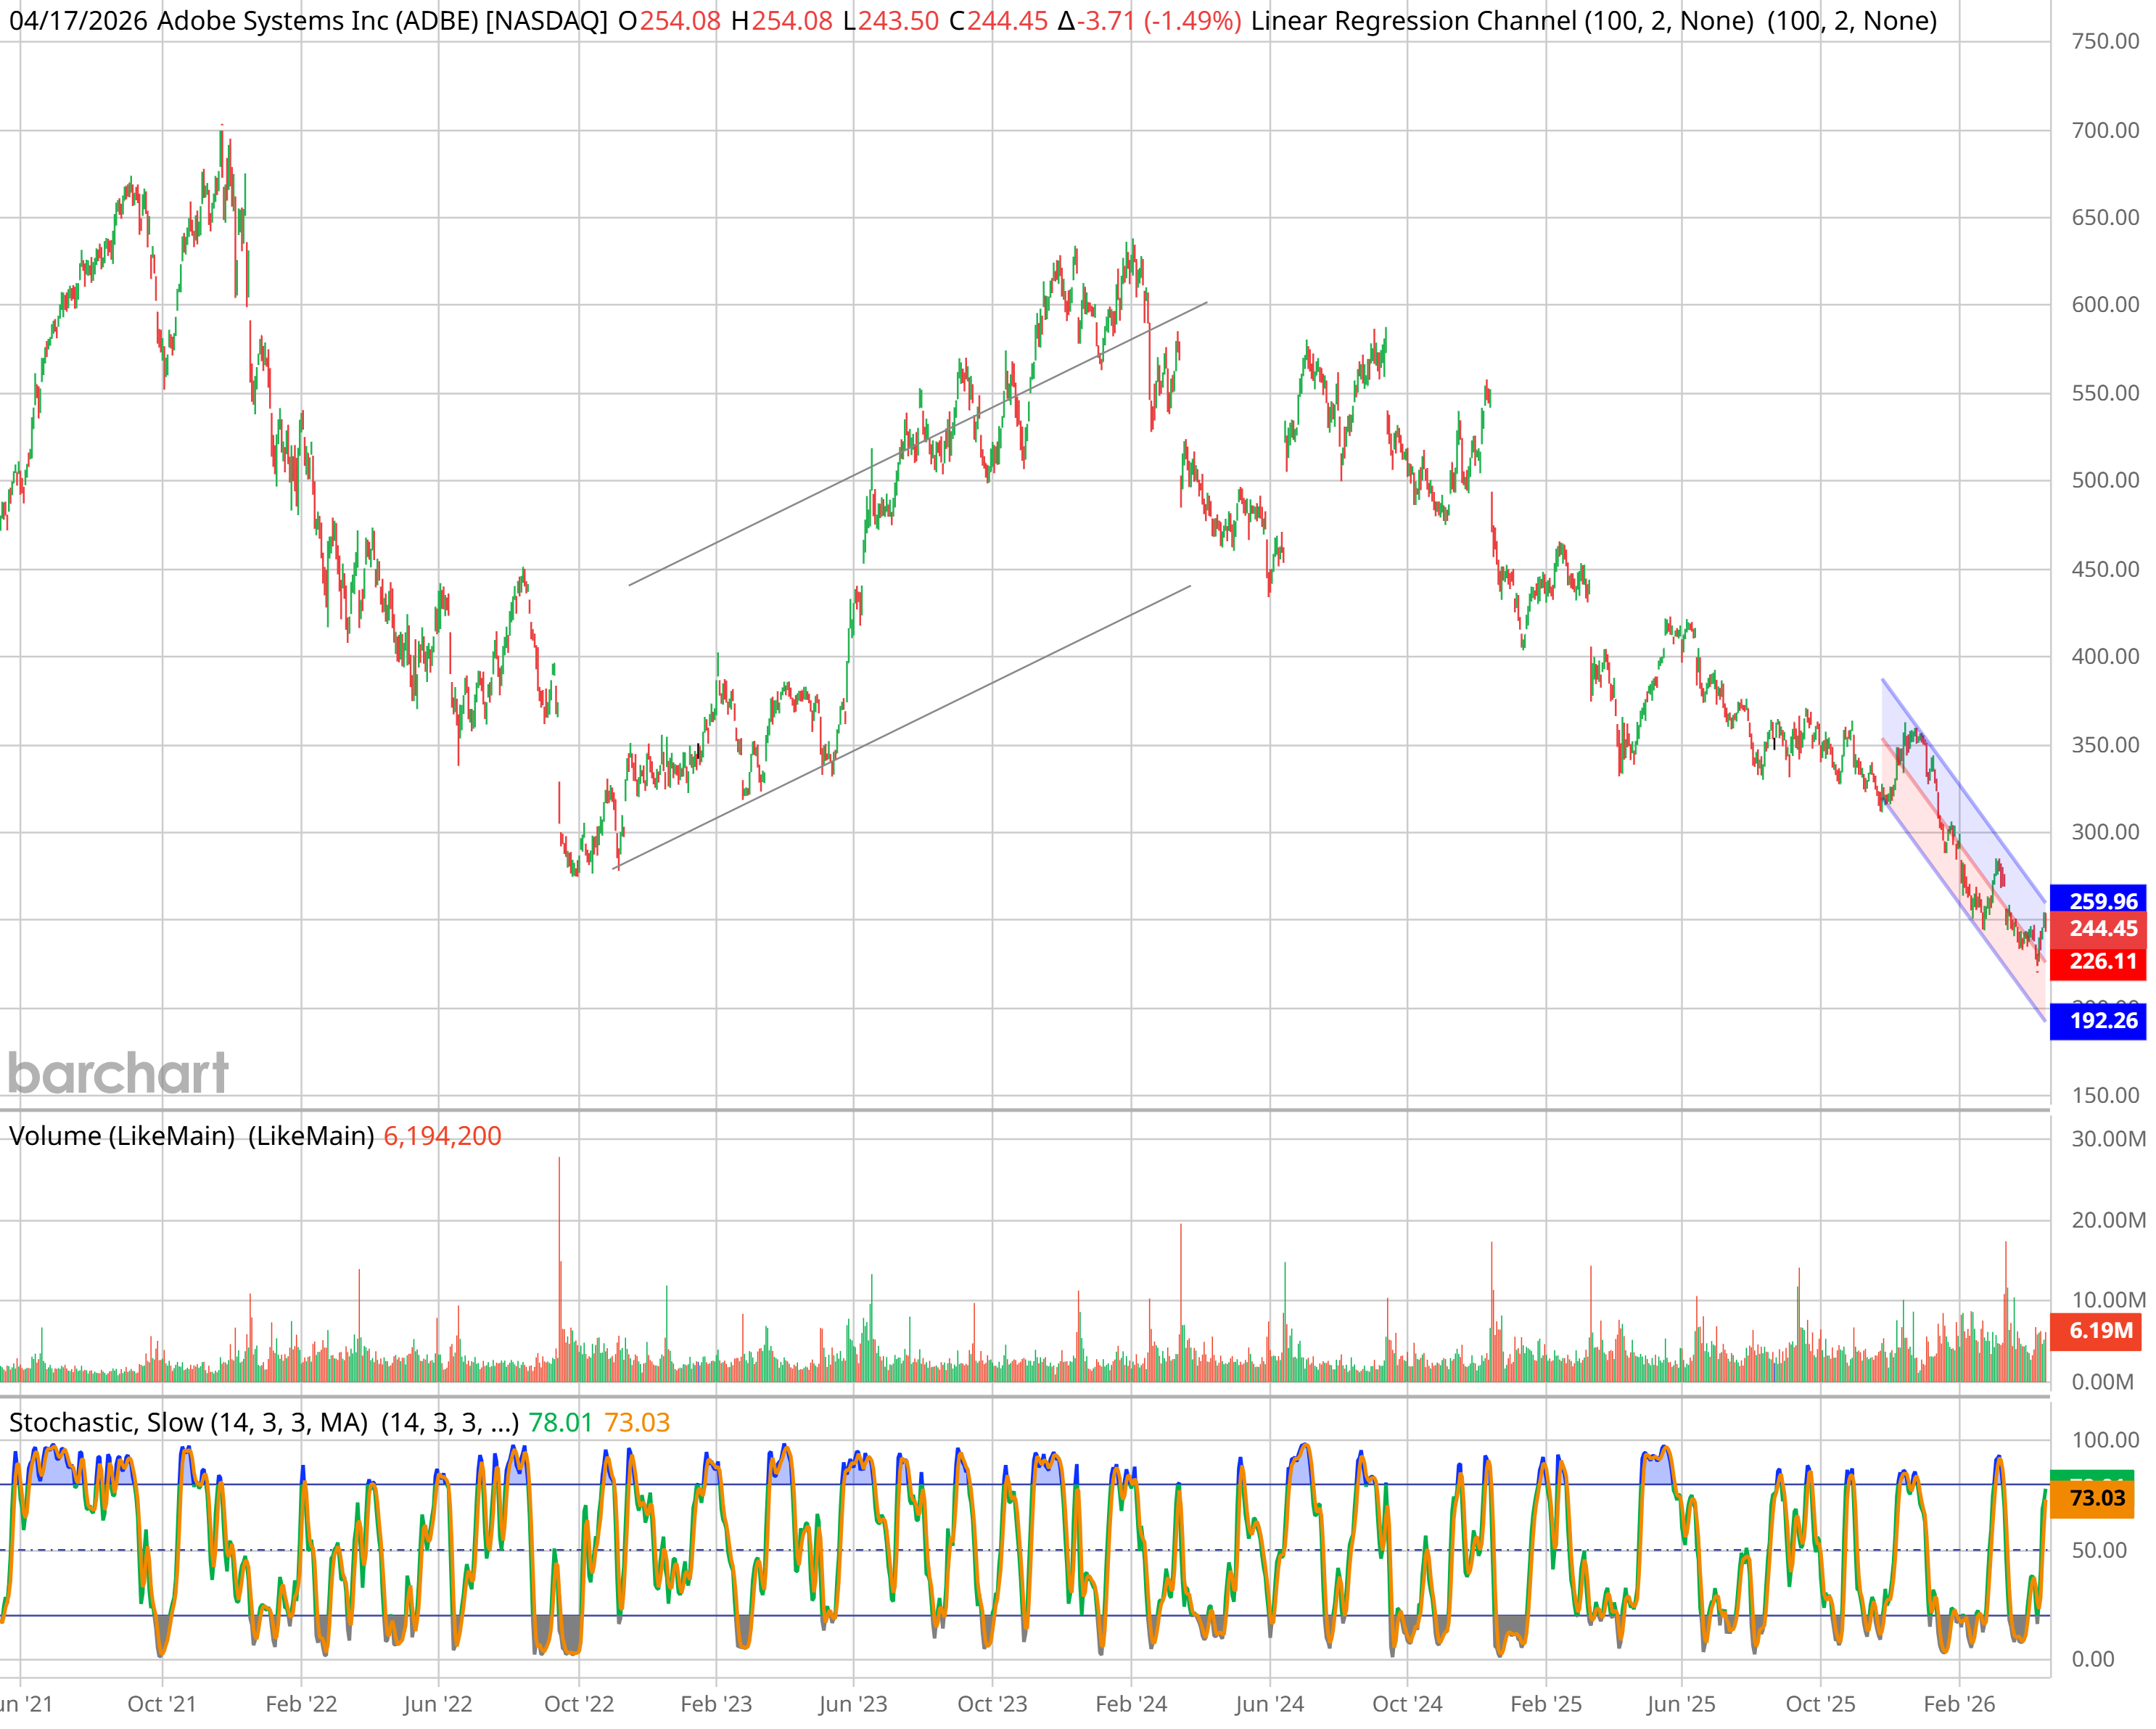
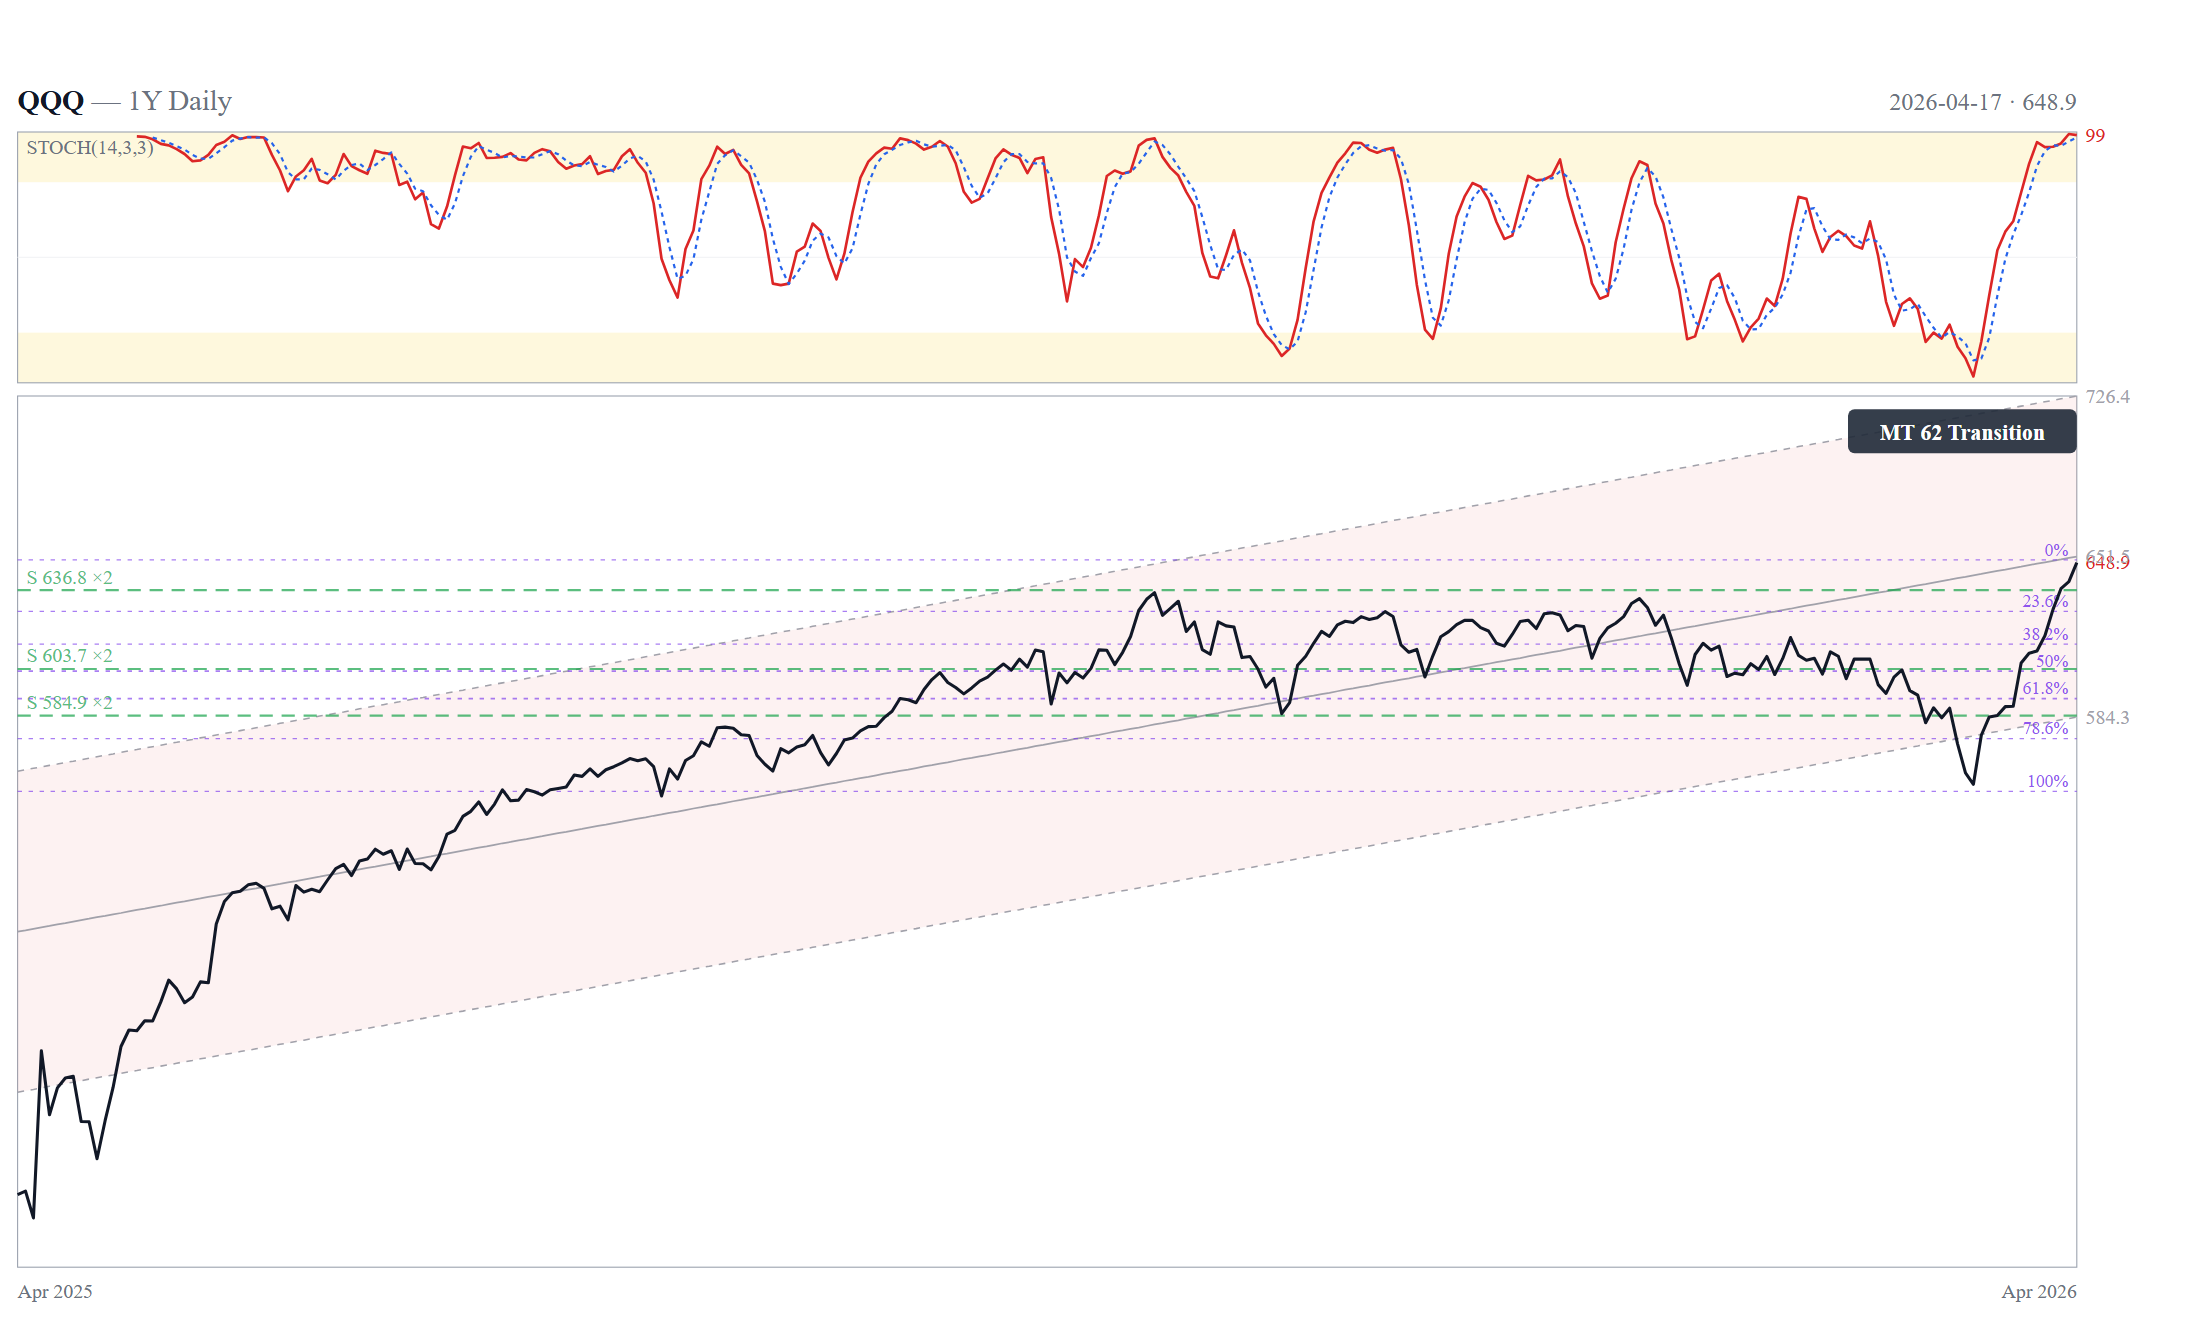
The attack. On Friday April 17, Anthropic launched Claude Design — powered by the newly released Claude Opus 4.7 vision model — a direct assault on the design software category occupied by Figma, Adobe, Canva, and Wix. Figma (FIG) closed $18.84, down 7.28% from the prior $20.32. Intraday the stock printed $21.45 early before fading to $18.79, a classic failed-breakout tape. Adobe (ADBE) closed $244.45, down 1.49%, with an intraday range $243.50–$254.08 and a 52-week range of $224.13–$422.95 — the stock trades near its yearly low, already down 29.9% year-on-year. Anthropic CPO Mike Krieger resigned from Figma's board three days before the launch. This was not an accidental release; it was a coordinated shot across the bow. QQQ rose 1.31% on the day to $648.85. IGV still rose 0.85% — underperforming QQQ by 0.46 percentage points but not breaking down.
The overhang. Two tail risks sit behind this specific setup. First, earnings season starts in earnest next week — Tesla on Wednesday, Alphabet on Thursday, multiple SaaS names in the two weeks after. Second, Persian Gulf tensions remain live despite the Friday headline that moved WTI −9%. Iran declared the Strait of Hormuz "fully open," Trump kept the naval blockade in force, Iran seized another tanker on the same day. JMIC's latest advisory counts only 8 transits through the Strait on April 9 versus a historical daily average of 138. The headline and the reality are not aligned. The broader market could weaken early in the week on either overhang.
(3) The Question
Do the attacked SaaS names — and the software ETF as proxy — outperform or match Nasdaq-100 over the next five trading days (April 21–25)?
- Subjects: ADBE, FIG, ADSK, CRM, NOW, INTU
- Proxy: IGV
- Benchmark: QQQ
- Window: April 21–25, 2026
- Pass: IGV matches or outperforms QQQ · the March bottom is real, Claude-Design pain is priced
- Fail: IGV underperforms QQQ by ≥ 2.0 percentage points · the March bounce was reflex, not bottom
- Ambiguous: Anything in between · the test is inconclusive, earnings arbitrate next
That is the entire edition. Everything below is the argument for why this question matters and how to read the answer.
(4) Why This Is A Litmus Test
Market microstructure has a rule that beats most fundamental frameworks for identifying bottoms: when bad news stops moving price down, the downside has been priced. It is the mirror of the euphoria rule, where good news stops moving price up because the upside has been priced. The mechanic underneath is seller exhaustion — everyone who was going to sell on the thesis has sold, and the marginal headline no longer finds a marginal seller.
This maps directly onto a specific dimension of the ABR (Agent Beneficiary Ratio) framework that drives our AI-disruption analysis. For ADBE and FIG, three of the four qualitative axes already flash red: high Legacy Exposure, low Agent Benefit, low Upside Unpriced. The only live question is whether Downside Unpriced has also been repriced to zero or whether it remains meaningfully positive. Thursday April 14's 6% FIG decline on the Krieger-resignation news-break already suggested the market was partially positioned. Friday's additional 7.28% confirms the market is still in the repricing phase. The next five days tell us whether the repricing is complete.
If IGV matches QQQ this week, the read is unambiguous: even the most exposed names in the software universe cannot be pushed lower by a direct existential attack, because the market has already written them into the Terminal archetype of the ABR framework. That outcome is paradoxically bullish — not as long-term winners, but as names where the downside is capped and any positive surprise produces asymmetric upside. If IGV breaks meaningfully below QQQ, the read is also unambiguous: Downside is not yet priced, the March bottom was a technical oversold bounce, and the next leg lower is coming.
(5) The Three Scenarios
Bottom is Real
IGV matches/beats QQQ. FIG holds $18, ADBE holds $240. Selective ETF add candidate.
Bounce Rejected
IGV underperforms QQQ ≥2pp. FIG loses $18. Stay flat — no adds, no shorts.
No Verdict
IGV ratio between 0 and −2pp. Defer to earnings cluster late April / early May.
Scenario A — Pass (confluent bullish for software). IGV matches or outperforms QQQ through Friday April 25. FIG defends $18, Adobe holds $240, the broader software cohort grinds sideways or higher against a rising QQQ. Reading: the March bottom is structural. Bad news is priced. The seller-exhaustion test passes. This opens the conversation for selective adds in the ETF — not single names — on the basis that Downside Unpriced has collapsed to near zero.
Scenario B — Fail (bounce rejected). IGV underperforms QQQ by two percentage points or more. FIG loses $18 and closes below $17.50. Adobe drops toward the 52-week low at $224.13. ADSK, CRM, NOW roll over in sympathy. Reading: the bounce was a short-covering reflex, not a bottom. The marginal seller is still present, Claude Design was catalyst enough to resume the downtrend, and the March low itself is on the table as a retest. Back to sidelines, no adds, wait for the next bottom signal — which would not arrive before the earnings-sequence completes.
Scenario C — Ambiguous (no verdict). IGV trades between 0 and −2.0 pp relative to QQQ. Some names hold, others roll. Intraday ranges stay wide, no clean resolution. Reading: the microstructure test is inconclusive. The next data point — earnings — becomes the arbiter rather than the tape. Defer all action until after the peer-group earnings cluster.
(6) The Watchlist
Specific names, Friday closes, and the levels that matter.
| Name | Ticker | Fri Close | Key Bull Level | Key Bear Level | Notes |
|---|---|---|---|---|---|
| Figma | FIG | $18.84 | Reclaim $20.32 | Break $17.50 | IPO'd 2024, −80% from post-IPO high, most direct victim |
| Adobe | ADBE | $244.45 | Reclaim $250 | Break $240 → $224.13 | 52-week low $224.13, −29.9% 1Y, near structural floor |
| Autodesk | ADSK | to confirm | to confirm | to confirm | Adjacent design peer, indirect read |
| Salesforce | CRM | to confirm | to confirm | to confirm | IGV 6.81% weight, broader SaaS signal |
| ServiceNow | NOW | to confirm | to confirm | to confirm | AI-native peer, different exposure profile |
| Intuit | INTU | to confirm | to confirm | to confirm | Adjacent productivity, indirect read |
| Software ETF | IGV | $85.08 | Reclaim $90 | Break $80 | Top weights: Oracle 9.5%, MSFT 9.0%, PLTR 8.2%, CRM 6.8% |
| Nasdaq-100 | QQQ | $648.85 | — | — | Benchmark for relative strength |
The single metric to watch is the IGV/QQQ ratio. It closed Friday at 0.1311. If the ratio holds or rises through next week, Scenario A is alive. If it falls through 0.1255, Scenario B is triggering. If it trades sideways in a narrow band, Scenario C.
The individual names matter less than the composite. FIG is the canary but also the most volatile; one name's idiosyncratic move can mislead. ADBE, with its near-52-week-low technical setup and lower beta, is a cleaner read. IGV as the ETF removes single-name risk entirely.
(7) Ten Public Names Most Exposed To Claude Design
Beyond Figma and Adobe, eight additional public companies operate in the surface area Claude Design now occupies — text-to-design, website creation, design assets, and marketing design tooling. Watching these as a cohort gives a sharper read than any single name. The composite behavior of ten attacked names across five trading days is a higher-conviction signal than Figma alone — Figma can be volatile for single-name reasons, but ten names moving in concert is a thesis signal.
Companies are tiered by directness of overlap with Claude Design's product surface — not by market cap, not by expected drawdown magnitude.
Tier 1 — Direct Substitutes (core business overlaps)
| # | Ticker | Company | Exposure Vector |
|---|---|---|---|
| 1 | FIG | Figma | Collaborative design and prototyping — direct competitor |
| 2 | ADBE | Adobe | Creative Cloud (Photoshop, Illustrator, XD) — broadest overlap |
| 3 | WIX | Wix | AI website builder — Claude generates websites from prompts |
| 4 | SQSP | Squarespace | Website + brand design builder — same workflow |
Tier 2 — Asset Marketplaces Exposed To AI Generation
| # | Ticker | Company | Exposure Vector |
|---|---|---|---|
| 5 | SSTK | Shutterstock | Stock imagery demand erodes when AI generates on-demand |
| 6 | GETY | Getty Images | Same thesis; Getty has specific legal exposure around AI training |
Tier 3 — Design-Adjacent Services
| # | Ticker | Company | Exposure Vector |
|---|---|---|---|
| 7 | GDDY | GoDaddy | Website creation + branding bundle — AI replaces the design layer |
| 8 | CMPR | Cimpress (Vistaprint) | Print design services — the one-pager/marketing-design workflow Claude Design explicitly targets |
Tier 4 — Marketing/Commerce With Design Component
| # | Ticker | Company | Exposure Vector |
|---|---|---|---|
| 9 | HUBS | HubSpot | Marketing Hub includes design tools for landing pages, emails, ads |
| 10 | SHOP | Shopify | Storefront customization and theme design — smaller share but material |
How To Read The Cohort
The composite test: compute the simple average 5-day return of these ten names against the 5-day return of QQQ through Friday April 25. If the cohort average matches or beats QQQ, Scenario A is confirmed at high conviction — the market has priced the ABR-framework Terminal read across the entire cohort, not just the two headline names. If the cohort average underperforms QQQ by 3 percentage points or more, Scenario B is confirmed — the Claude Design repricing is still in progress across the full surface area, not concentrated in Figma.
Tier-by-tier divergence is itself signal. If Tier 1 underperforms but Tiers 3–4 hold, the repricing is specific and contained — the broader software tape is fine. If Tier 4 underperforms while Tier 1 holds, the opposite signal — Figma and Adobe have capitulated, the surprise damage is spilling into adjacent names that had not been repriced. The most bearish read is all four tiers underperforming together; the most bullish is all four tiers matching or beating QQQ despite the direct Tier-1 attack.
Honorable mentions — not in top ten but worth monitoring: Autodesk (ADSK) for architectural/engineering design, Salesforce (CRM) for Marketing Cloud, Monday.com (MNDY) for visual workflow, Vimeo (VMEO) for video creation, Dropbox (DBX) for Paper and design collaboration.
(8) What This Signals For The Broader Tape
Special editions are not only about the specific question — they are also probes for the health of the broader thesis. This week's litmus test feeds directly back into the April-rally narrative that our Global and US editions both track.
If Scenario A plays out — SaaS holds — it confirms the breadth-broadening argument. The April rally is not narrow to AI megacaps and semiconductors; it is a true multi-sector risk-on move in which even the most-attacked names cannot be pushed down. That is a bullish tape signal well beyond software. The Confluent Bullish verdict from this weekend's Closelook@Global edition stays intact at high confidence.
If Scenario B plays out — SaaS breaks — it is a warning signal for the entire April rally. The bounce in software was the most visible evidence of breadth. If it fails here, the rally is narrower than it reads — driven by mega-cap AI and semis while the broader software universe continues its secular derate. The Confluent Bullish verdict then deserves a downgrade. Not a bear call, but an honest acknowledgement that the breadth leg is weaker than the tape suggests.
If Scenario C plays out — nothing decisive — neutral. The verdict holds through the earnings sequence; the answer arrives in the earnings prints rather than in the tape.
(9) Decision Tree
No positioning moves before Wednesday close. This is a microstructure test; the first two days can produce noise that looks decisive but isn't. Tuesday–Wednesday provides signal with sufficient conviction to act, Thursday–Friday confirms or refutes.
By Wednesday close, if Scenario A is tracking: consider a selective add in IGV. Initial size 0.5 percentage points of portfolio weight. Scale up to 1.0 pp only on confirmation through Friday close. No single-name adds — the question being answered is composite, not idiosyncratic.
By Wednesday close, if Scenario B is tracking: stay flat. Do not add software exposure. Do not short either — a 6-sigma IGV/QQQ divergence is already priced, and short setups after a 14% weekly bounce carry elevated squeeze risk. The disciplined move is to watch, not trade.
By Friday close, Scenario C still ambiguous: defer decision entirely. Wait for the earnings cluster to arbitrate. The SaaS earnings calendar tightens through the last week of April and the first two weeks of May; there will be no shortage of signal.
(10) What Comes After The Test
The five-day microstructure test answers exactly one question: is the March bottom technically intact? It cannot answer the separate question: is the bottom fundamentally supported? Earnings do that job. Tesla reports April 22, Alphabet April 23, and the main SaaS cohort follows in the weeks after. A Pass verdict on this week's test buys the thesis time to be validated by fundamentals. A Fail verdict makes fundamentals the rescue rather than the confirmation — a weaker, riskier setup.
The larger arc: this test is one data point in a longer ABR-framework live observation. The "AI replaces SaaS" narrative has been the dominant bear thesis for the legacy names for over two years. The cumulative repricing — IGV down 24.7% year-to-date versus QQQ up 2.5% through April 14, a 6-sigma relative divergence — suggests the thesis is mostly reflected in price. The question this Weekly Signal Special is asking is whether "mostly" has finally become "fully."
When a stock or sector cannot be pushed down by its worst possible headline, the seller who was going to sell has sold. That is not an investment thesis — it is an observation about market microstructure. But it is the observation that typically precedes the end of a bear phase by days to weeks, and it is the only observation that can be made from the tape itself rather than from fundamentals. Five trading days from tomorrow's open, we will know.
(11) Next Edition
The regular nine-dimensional Weekly Signal scorecard returns next Sunday, April 26, 2026 — covering BTC, NDX, SMH, Gold, TLT, FTSE Global ex-US across the full Macro / Liquidity / Trend / Participation / Breadth / Volatility / Sentiment / Momentum framework.
A mid-week Weekly Signal Update publishes Wednesday evening CET with the scenario-tracking verdict: which of A, B, C is live by the Wednesday close, and what the tape has said so far.
Closelook Weekly Signal · Special Edition · closelook.net/weekly/ Thomas Look · [email protected]