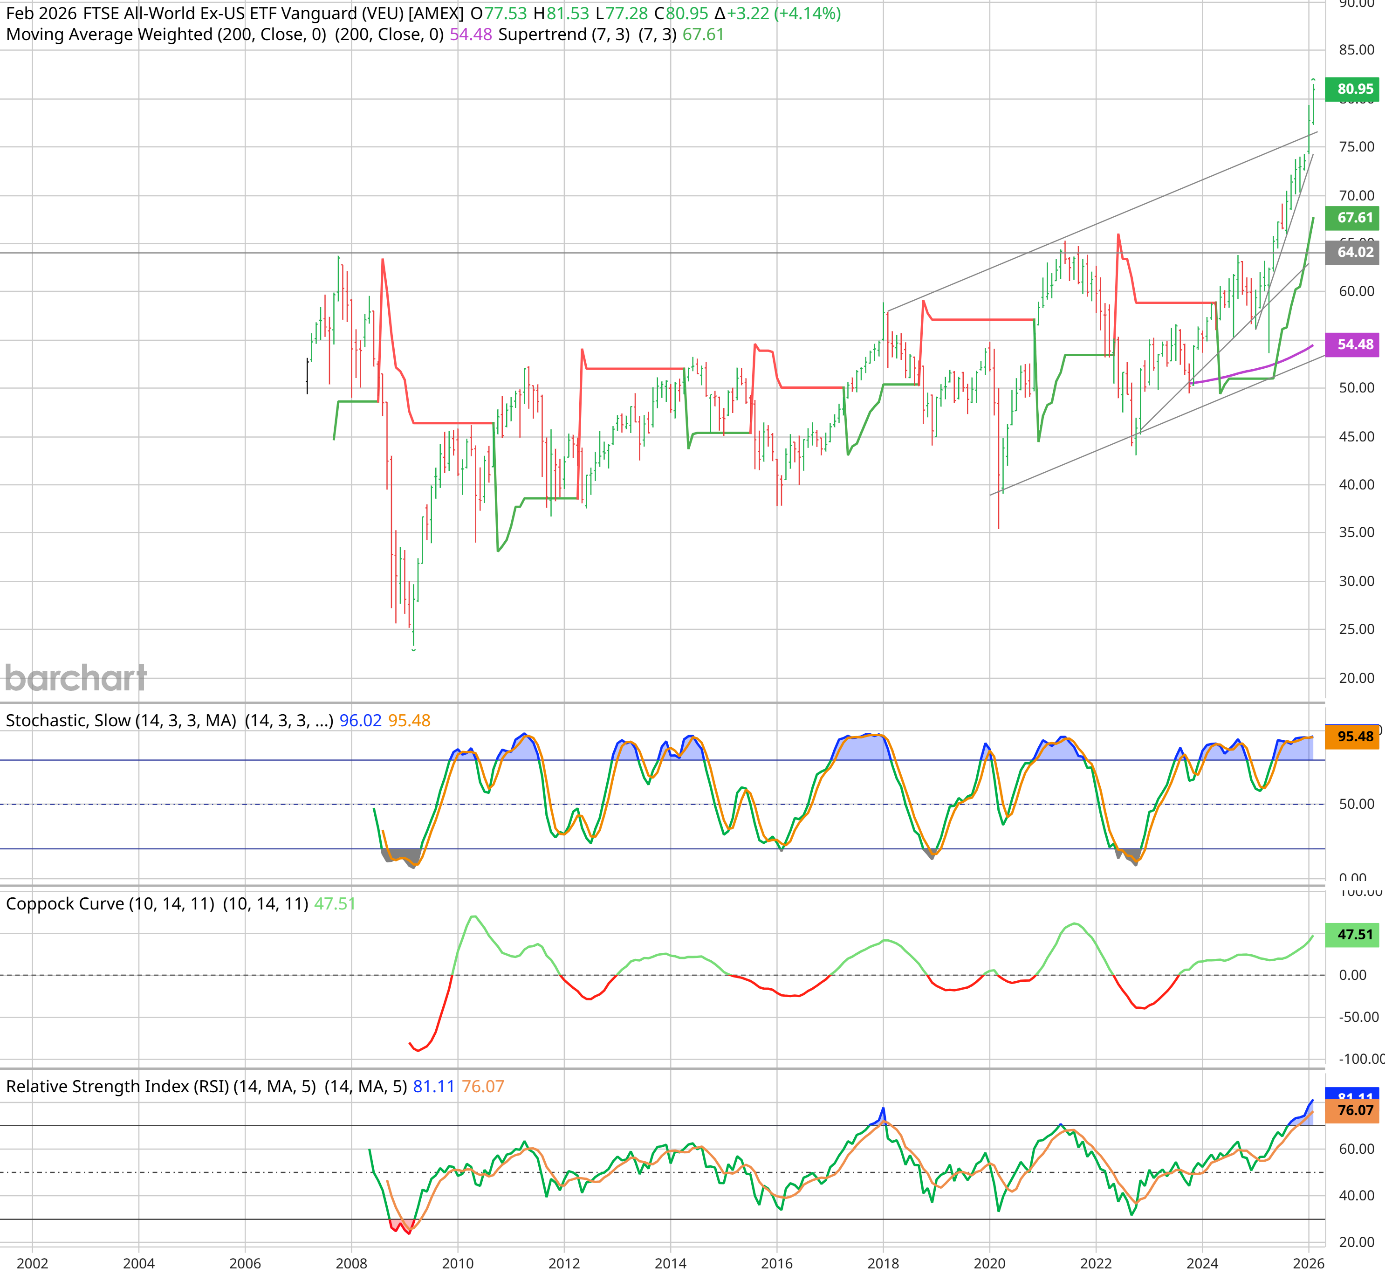
For the better part of fifteen years, global capital was hyper-concentrated in U.S. equities — specifically mega-cap technology. The rest of the world was largely treated as an afterthought. However, as the monthly chart of the Vanguard FTSE All-World ex-US ETF (VEU) — updated through February 2026 — clearly illustrates, a historic, tectonic shift in global capital flows has occurred.
The "lost decade" for international stocks may be over. Put simply, for a U.S.-based investor, going abroad may beat staying home for quite some time. Here is a comprehensive technical, fundamental, and macroeconomic analysis detailing the anatomy of this secular breakout.
Part 1: Technical Analysis — The Anatomy of a Generational Breakout
This chart is a masterclass in long-term base building and structural market cycles. The technical evidence points to a massive release of pent-up kinetic energy.
The Horizontal Resistance: The 2008/2009 Highs
- The $64.02 Ceiling: The most critical feature on this chart is the horizontal resistance line at $64.02. This level represents the absolute peak of the pre-Global Financial Crisis (GFC) bubble in 2007/2008.
- The Secular Signal: For roughly 15 years, this level acted as an impenetrable ceiling, swatting down major rally attempts — most notably the double-top in 2021. The decisive, high-momentum monthly closes above $64.02 signaled the completion of a massive multi-decade consolidation base. In technical parlance: "the bigger the base, the higher in space."
The Three Ascending Trendlines: Accelerating Momentum
The chart features three distinct ascending trendlines that map the widening, compounding momentum of this bull run:
- Primary Macro Support (Bottom Line): Connecting the generational panic low of 2009 with the 2020 COVID-19 crash low. This establishes the absolute bedrock of the international market's macro uptrend.
- Accelerated Support (Middle Line): Connecting the 2020 low to the 2022 bear market low. This steeper angle of attack highlights "momentum acceleration" as institutional capital began aggressively buying dips at higher valuations.
- Channel Resistance (Top Line): Connecting the cyclical peaks of 2018 and 2021. Historically, this line contained VEU's upside.
Indicator Confirmation
- Trend Followers: The Supertrend (7,3) is pristine green at $67.61, providing a dynamic macro trailing stop well below the current price. The 200-period Weighted Moving Average is curling upward at $54.48, confirming deep structural support.
- Momentum Oscillators: The RSI is blazing hot at 81.11, and the Slow Stochastic is pinned at 96.02. While traditionalists might call this "overbought," on a long-term monthly chart, oscillators embedding in these extreme upper registers are the hallmark of a true secular bull market.
- Coppock Curve: Sitting at 47.51 and rising smoothly, this long-term momentum indicator confirms the macro-cyclical trend is heavily skewed to the upside with absolutely no bearish divergence.
Part 2: Under the Hood — The VEU Portfolio Breakdown
To understand why this massive technical breakout is happening, we have to look at what VEU actually holds. Unlike the S&P 500, which is top-heavy with software and digital services, VEU is functionally a bet on a physical, capital-intensive global economy anchored by hardware, global financials, and defensive "Old Economy" staples.
Top 10 Holdings (11.08% of Total Assets)
| # | Ticker | Company | Sector | Weight |
|---|---|---|---|---|
| 1 | 2330 | Taiwan Semiconductor (TSMC) | Technology | 3.02% |
| 2 | 700 | Tencent Holdings Ltd. | Comm. Services | 1.51% |
| 3 | 9988 | Alibaba Group Holding Ltd. | Cons. Discretionary | 1.14% |
| 4 | ASML | ASML Holding NV | Technology | 1.10% |
| 5 | 5930 | Samsung Electronics Co. | Technology | 0.80% |
| 6 | SAP | SAP SE | Technology | 0.79% |
| 7 | HSBA | HSBC Holdings PLC | Financials | 0.70% |
| 8 | NOVN | Novartis AG | Health Care | 0.69% |
| 9 | ROG | Roche Holding AG | Health Care | 0.67% |
| 10 | NESN | Nestlé SA | Cons. Staples | 0.66% |
Sector Dispersion: The "Old Economy" Tilt
Roughly 50% of the ETF is weighted in Financials, Industrials, Materials, and Energy — the exact opposite of domestic U.S. indices.
| Sector | Weight | Macro Implications |
|---|---|---|
| Financials | ~21.5% | Value mean-reversion; benefits from normalised global interest rates and steeper yield curves. |
| Industrials | ~14.5% | Beneficiaries of global infrastructure spending, defence budgets, and supply chain reshoring. |
| Technology | ~11.5% | Hardware & semis (TSMC, ASML, Samsung) — not the US software overweight. |
| Cons. Discretionary | ~11.5% | Expanding EM middle classes and post-inflation consumer recoveries. |
| Health Care | ~9.0% | Deep-value European pharma giants with defensive stability and high dividends. |
| Basic Materials | ~7.5% | Structural commodity bull market and green energy transition raw materials. |
| Consumer Staples | ~7.0% | European food/beverage mega-caps with inflation-resistant pricing power. |
| Energy | ~5.5% | Global supply constraints, capital discipline, and sustained fossil-fuel demand. |
| Telecom / Comm. | ~4.5% | High-yielding global telecom and discounted ex-US tech giants. |
| Utilities / Real Est. | ~5.0% | Regulated hard assets and infrastructure acting as dividend anchors. |
Regional Dispersion: Deep Global Diversification
| Region | Weight | Key Macro Drivers |
|---|---|---|
| Europe | ~39.5% | Pure value mean-reversion. Capital flowing back into banks, luxury brands, and industrials. |
| Emerging Markets | ~26.5% | Primary growth engine. Supply-chain shifts and Asian tech hardware dominance. |
| Pacific | ~26.0% | Japan's corporate governance reforms, deflation exit, and Australia's mining exports. |
| North America | ~7.5% | Canada's commodity, precious metals, and energy supercycle dominance. |
Part 3: Macroeconomic Analysis — The Fuel for the "Rest of World" Boom
Technical breakouts of this magnitude do not happen in a vacuum — they are the footprints of shifting macroeconomic tectonic plates.
A. Extreme Valuation Mean Reversion
By 2023/2024, the valuation gap between U.S. equities (trading at extreme forward P/E multiples priced for perfection) and the rest of the world reached dot-com-era extremes. The VEU breakout represents global institutional capital finally reallocating toward cheaper, value-oriented markets that offer higher dividend yields and more attractive risk premiums.
B. The US Dollar (DXY) Cycle
Historically, international equities (priced in unhedged USD via VEU) have a strict inverse relationship with the U.S. Dollar. The secular, parabolic breakout in VEU strongly implies that the U.S. Dollar has peaked and rolled over into a structural bear market. As the greenback weakens, global liquidity conditions ease, providing a massive mechanical tailwind for ex-US equities.
C. The Resurgence of the "Old Economy"
A secular bull market in VEU suggests a global macroeconomic environment characterised by robust infrastructure spending, supply chain reshoring, and a structural commodity bull market. The industrial and commodity-exporting powerhouses drastically outperform long-duration U.S. tech/software in this regime.
D. Structural Regional Reforms
Japan's corporate governance reforms and its exit from decades of deflation have attracted historic foreign inflows. Supply-chain shifts have supercharged growth in emerging markets like India and Latin America, diversifying the global economy's reliance on China.
TACO Your Investment Strategy!
Tariffs. America-first trade policy. Currency weaponisation. Outflows from overvalued U.S. mega-cap.
The Trump Administration's aggressive trade posture — tariffs, reshoring mandates, and the deliberate use of the dollar as a geopolitical lever — is accelerating the very capital rotation this breakout is capturing. Every tariff headline paradoxically pushes more global capital toward the beneficiaries inside VEU: European industrials, Asian foundries, commodity exporters, and EM consumer markets winning the supply-chain rerouting game.
TACO is not just a policy framework — it is the macro accelerant behind the secular bull in ex-US equities.