Weekly Signal · Bitcoin

Bitcoin Weekly Signal

7-Level, 9-Dimension Regime Analysis — Week of Feb 24, 2026
Composite Score
37
🔴 Regime Change
~$69K breached intraweek — not on weekly or monthly close. Kill level tested, not confirmed. This week's close is decisive.
Verdict
On the edge. ~$69K violated intraweek but not on weekly close — bear case favored, not yet confirmed.
0 — Extreme Bear 50 — Neutral 100 — Extreme Bull
80–100 Bullish
50–79 Transitional
0–49 Bearish

Quantitative Dimensions

Levels 1–3 + Level 5 — Numerically scored, weighted composite
D1
Macro Regime
Price vs 200WMA · slope direction
20%
15
D2
Liquidity
Real rates · Global M2 · DXY
15%
65
D3
Trend
SuperTrend weekly
15%
20
D4
Participation
A/D line · on-chain exchange flows
15%
38
D5
Breadth
BTC.D · altcoin breadth · % above 200DMA
10%
55
D6
Volatility
DVOL / BVIV · term structure
10%
60
D7
Sentiment
Fear & Greed · funding rates · CME COT
10%
30
D9
Momentum
Stochastic(14,3,3) · RSI
5%
25
BTC/USD — Monthly · Elliott Wave Count + Fibonacci Retracements
TradingView · 1M · Bitstamp
BTC Monthly Chart — Elliott Wave count with Fibonacci retracements

Dimension Breakdown

D1 · 20%
15
Macro Regime
Price vs 200WMAWell below — $68K vs 200WMA at $97.3K
200WMA SlopeFlattening
Deviation−30% below 200WMA
Price has fallen significantly below the 200WMA ($97.3K) — a clear macro bear signal. The deviation is extreme but 200WMA slope hasn't turned down yet, which means the long-term trend hasn't fully reversed. Watch the slope.
D2 · 15%
65
Liquidity
US 10Y Real Rate+2.1% — headwind
Global M2 (YoY)+4.2% expanding
DXY97.82 — weak, below 100
Two of three indicators bullish. Global M2 expanding and dollar weak (DXY below 100) — both tailwinds for risk assets and crypto. US real rates remain the headwind. Historically, DXY below 100 has coincided with BTC strength — a notable divergence from the current price decline.
D3 · 15%
20
Trend
SuperTrend (7,3)SELL at $80,737
DirectionLower highs, lower lows
Price vs ST$68K — 16% below trigger
Weekly SuperTrend flipped to sell at $80,737. Price now 16% below the trigger — deep into sell territory. Not a marginal signal — this is a confirmed, sustained breakdown.
D4 · 15%
38
Participation
A/D LineDeclining — distribution
Exchange FlowsNet inflows (sell pressure)
Volume ProfileDeclining volume on bounces
Consistent distribution. Exchange inflows = holders moving to exchanges (bearish on-chain). Rallies on declining volume indicate low conviction buying.
D5 · 10%
55
Breadth
BTC Dominance58.2% — rising
Altcoin BreadthWeak — broad decline
BTC dominance rising while altcoins bleed — classic risk-off rotation within crypto. BTC as "safe haven" in the space. Less bearish for BTC specifically than for broader market.
D6 · 10%
60
Volatility
DVOL (Deribit)62 — elevated
BVIVContango (normal)
Term StructureNo inversion
Elevated IV but normal term structure (contango). No panic or capitulation — "orderly selling." Lack of DVOL spike suggests bottom is not in yet.
D7 · 10%
30
Sentiment
Fear & Greed Index22 — Extreme Fear
Funding RatesSlightly negative
CME COTSpecs net short
Deep fear. Contrarian signal — but fear persists for months in bear markets. Negative funding + CME specs net short confirms institutional directional conviction. Watch for <10 as capitulation marker.
D9 · 5%
25
Momentum
Stochastic(14,3,3)27.3 / 25.0 — oversold
RSI (14)32.7 — approaching oversold
MACD WeeklyBearish — below signal
Deeply oversold on multiple timeframes. Doesn't mean "buy" — oversold stays oversold in bear regimes. Countertrend bounce possible but requires confirmation from D1 and D3.
BTC/USD — Weekly · 200WMA + SuperTrend + Stochastic + Coppock + RSI
Barchart Premier · Weekly
BTC Weekly Chart — 200WMA, SuperTrend, Stochastic, Coppock Curve, RSI

Qualitative Analysis

Levels 4, 6, 7 — Structure, Decision, Risk
Level 4 · Structure
Channels, Fibs & EW Overlay
Ascending channel from 2023 low broken. Price testing the lower channel boundary from below as resistance.
  • 50% Fib retracement: ~$74K — broken
  • 61.8% Fib: ~$61K — next major support
  • Channel lower bound: ~$60K–$61K (Fib confluence)
  • 78.6% Fib: ~$41K — if 61.8% fails
Level 6 · Decision
Playbook Synthesis
Framework signals 🔴 Regime Change. Playbook: do not fade, follow new trend.
  • No new longs until regime flips
  • Existing positions: reduce or hedge
  • Watch bellwethers (MSTR, COIN, miners) for early reversal signs
  • Potential entry zone: ~$61K–$69K confluence
Level 7 · Risk
Invalidation & What Can Go Wrong
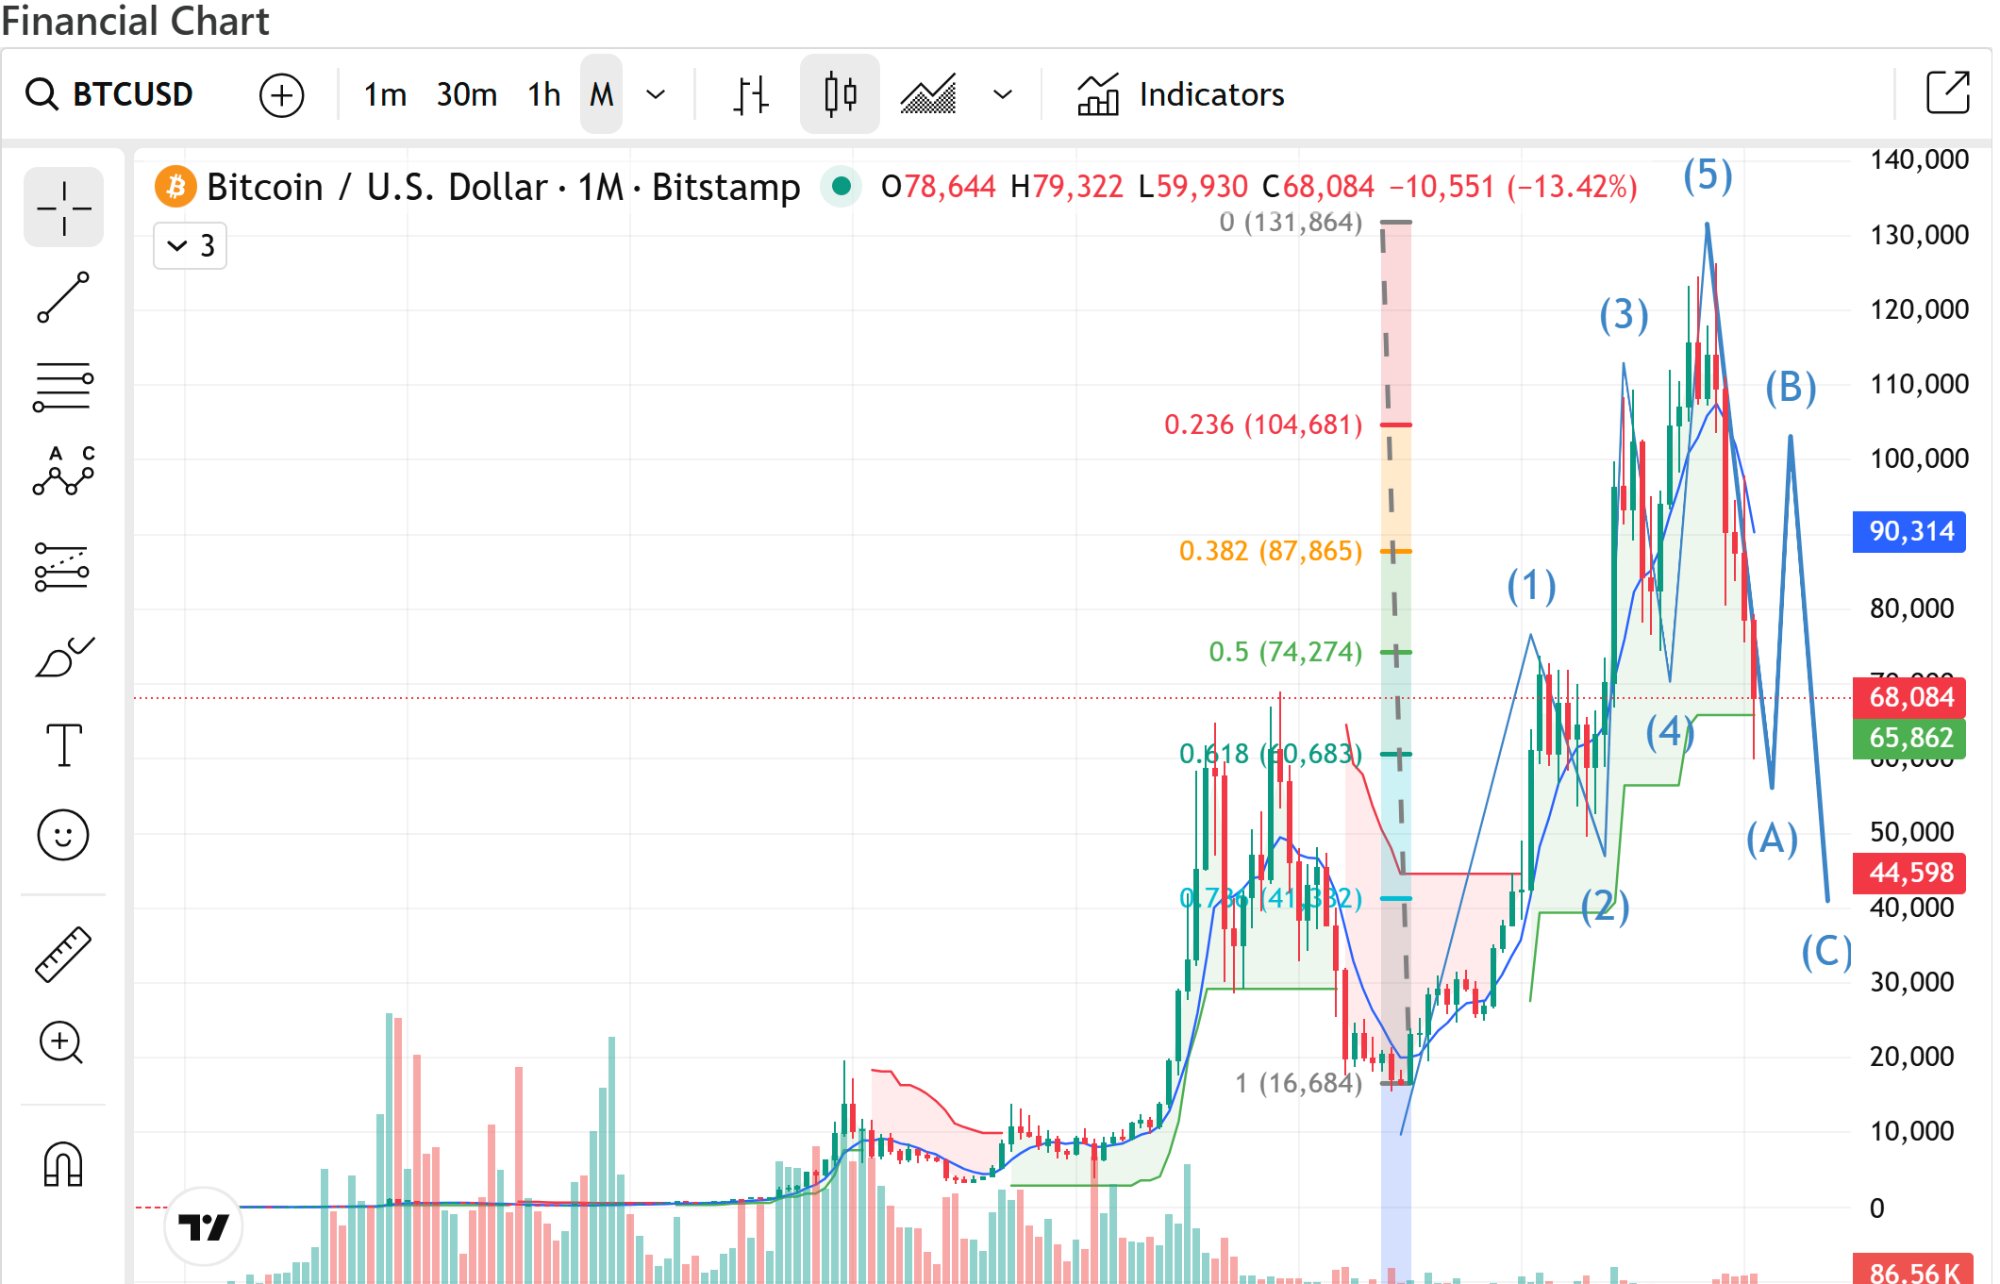
The ~$69K kill level was breached intraweek but has not been violated on a weekly or monthly close. This is the single most important variable right now — the market is on the razor's edge. The intraweek breach favors the bear case, but until a closing violation occurs, the extended wave 3 count is technically alive (if damaged).
  • ~$69K intraweek breach: wick below occurred — bear case favored but not confirmed
  • Weekly/monthly close below ~$69K: kills both bull counts — only bear ABC remains
  • Weekly close back above $72K+: reclaims territory, extended count regains credibility
  • Extended count risk: impulsive reversal from here catches bears offside
  • Time factor: every week spent near ~$69K without a close below favors bears — distribution, not accumulation
⚠ Elliott Wave Overlay — Not Scored
Primary count (bearish, favored): 5-wave impulse from 2022 low (~$16.7K) to ~$132K is complete. Currently in wave A of a larger ABC correction. The 50% retracement (~$74K) has been lost. Critical level: ~$69K — top of Wave 1. Price wicked below ~$69K intraweek, but has not closed below on a weekly or monthly basis. A weekly close below would definitively confirm the bear count and eliminate all bullish wave interpretations. The market is sitting precisely on the decision point — the intraweek breach favors bears, the absence of a closing violation keeps the door open for bulls. The 61.8% at ~$61K aligns with channel support — the next major target if ~$69K gives way on a closing basis.
↗ Alternative Count — Extended Wave 3
Alternative count (bullish): The move from ~$16.7K to ~$132K did not complete a full 5-wave cycle. Instead, we are witnessing an extended wave 3 at a higher degree — a 9-wave subdivision rather than the standard 5. Under this count, the current decline is wave 6 of the extension, and wave 7 (the final impulse sub-wave of extended wave 3) is about to begin. This would be followed by wave 4 and wave 5 at the higher order, implying significantly higher prices ahead.

Critical EW rule: The current corrective wave (wave 4 inside extended wave 3) must not close below the top of wave 1 of wave 3 — the ~$69K level. This level was breached intraweek — the wick went below — but has not been violated on a weekly or monthly closing basis. The extended count is alive but damaged. Purists would argue an intraweek breach already disqualifies the count; pragmatists note that only closing violations are definitive in EW practice. Either way, this count is hanging by a thread. A weekly close below ~$69K eliminates it entirely.

What would confirm: Price holds above ~$69K, followed by an impulsive (not corrective) reversal. Weekly close back above ~$88K (38.2% Fib) with expanding volume would be the first structural signal. Bellwether stocks (MSTR, COIN) leading the turn would add conviction. Under this count, the $61K–$69K zone is the buying opportunity, not a level to fear.

Supplementary

Coppock Curve
−44.0
Deeply negative and accelerating downward. Last time this negative was the 2022 bear market. Long-term sell signal confirmed.
BTC Bellwethers
Weak
MSTR, COIN, miners all in downtrends. No signs of basing or relative strength vs BTC.
On-Chain MVRV
1.4x
Above 1.0 (not capitulation). Historical bottoms at 0.8–0.9x. More downside possible.

Scenarios & Key Levels

Bull Case — Extended Wave 3 (20% probability, declining)
Extended count alive but damaged by the intraweek breach of ~$69K. If this is wave 6 of the extension, wave 7 begins here targeting $90K–$100K+. But the market must close the week above ~$69K to keep this count viable. Every week spent at this level without impulsive reversal erodes probability further.
Survival: ~$69K weekly close · Trigger: ~$88K reclaim
Bear Case — 5 Waves Complete (80% probability, rising)
Full 5-wave impulse from 2022 is done. The intraweek breach of ~$69K is the market testing the kill level — weekly or monthly close below seals it. Correction deepens toward 61.8% (~$61K) and potentially 78.6% (~$41K). Timeline: 3–6 months of weakness with bear rallies that fail at lower highs.
Key level: ~$61K (61.8% Fib breakdown)
LevelPriceTypeSignificance
38.2% Fib~$88KResistanceBull reclaim target — close above invalidates bear thesis
Wave 1 Top~$69KBREACHED INTRAWEEKEW kill level — wicked below, no weekly/monthly close below. This week decisive.
61.8% + Channel~$61KConfluence SupportChannel lower bound + Fibonacci — potential Wave A bottom
78.6% Fib~$41KDeep SupportExtreme scenario if 61.8% fails — full bear territory
📋
This Week's Playbook
Regime state: 🔴 Regime Change — on the edge. The framework scores bearish across five of eight dimensions. The ~$69K kill level was breached intraweek — the wick went below — but no weekly or monthly close has confirmed the breakdown. This is not a comfortable hold in either direction. The bear case is favored but not sealed.

Micro structure matters. At the sub-wave level, wave A likely needs one more leg down before completing — the typical internal count is 5-3-5, and we appear to be in the final impulse. Wave B would then retrace 50–61.8% of A (preferred) before wave C takes price to the final corrective target. An alternative 3-3-5 flat could see wave B retrace up to 100% of A, but this is not the preferred count.

Action: Stay sidelined. We would initiate a long position only under two conditions: (1) one more leg down completes wave A with a capitulation signature — volume spike, DVOL inversion, Fear & Greed below 10 — followed by a clear wave B setup, or (2) a structural trend break to the upside that signals a potential move back toward all-time highs, confirming the extended wave 3 count.

Bottom line: there are better opportunities to trade right now. The risk/reward on BTC at ~$69K is poor in both directions — too close to the kill level for a confident long, too oversold for an aggressive short. Wait for resolution. The market will tell you when it's ready.