Bitcoin remains in regime-change territory at 38/100 — the second consecutive red signal. Five of eight quantitative dimensions score below 50. The macro backdrop is hostile, the trend is down, and momentum has not confirmed any reversal.
However, structural evidence is building that the corrective pattern from the October 2025 all-time high may be approaching completion. The weekend's Iran-US military escalation — the most significant geopolitical shock since Russia's 2022 invasion of Ukraine — failed to produce a new cycle low. Price tagged $63,000 and held above the February low of $60,187, creating the first higher low since the correction began.
This is not a buy signal. The framework scores the present, and the present is red. But the structural overlay — a WXY corrective pattern completing at the lower boundary of a five-month descending channel, with Fibonacci confluence and extreme fear readings — creates the conditions where turns begin.
Monday's US market open is the critical test. ETF flows will determine whether the weekend bounce has institutional backing or whether it fades under renewed macro pressure.
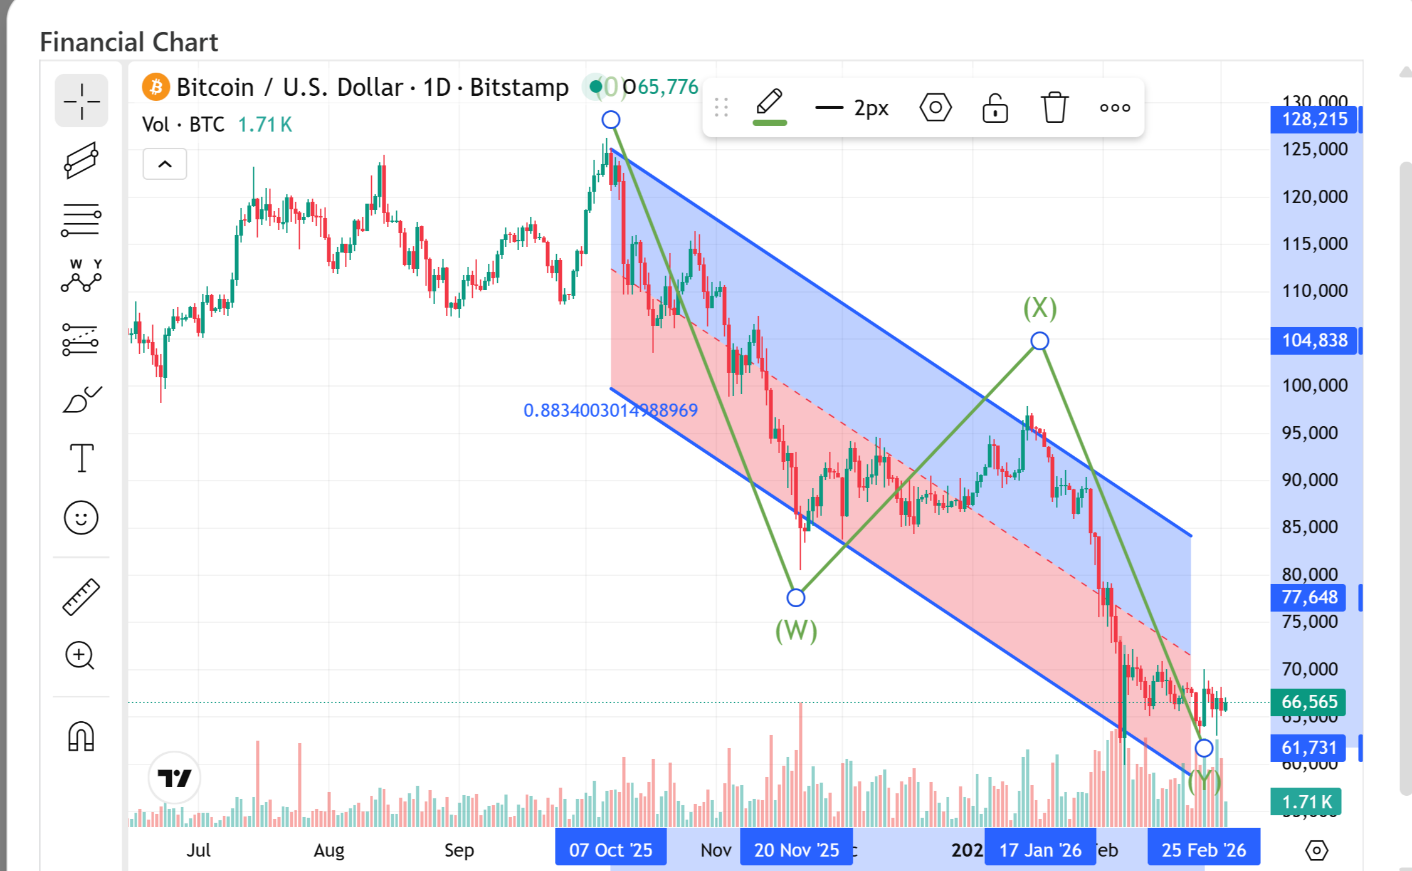
Chart Analysis
The primary chart structure since the October 2025 ATH at ~$128,000:
Descending Channel: Blue parallel lines from the October high, containing all price action. The upper boundary has been respected on every rally. The lower boundary was tagged on Feb 25 ($60,187) and again on Feb 28 ($63,068).
WXY Corrective Pattern:
- (W): Impulse down from $128K to ~$78K (Oct-Nov 2025). Classic five-wave decline.
- (X): Relief rally to ~$105K (Dec 2025-Jan 2026). Retraced approximately 0.618 of wave (W). This is the rally that generated renewed bull market narrative and trapped late longs.
- (Y): Grinding decline from $105K, currently at $66K. More complex and time-consuming than (W), consistent with alternation guidelines. Price has now reached the lower channel boundary and the 0.883 Fibonacci retracement of the entire 2023-2025 bull move.
Fibonacci Confluence Zone: The 0.883 retracement at approximately $60-63K aligns with the lower channel boundary and the January 2025 pre-rally base. Three independent structural elements converging on the same price zone.
Key Observation: The Iran-US war weekend (Feb 28-Mar 1) produced no new low. The intraday low of $63,068 held above the Feb 25 low of $60,187. In corrective pattern analysis, the failure to extend lower at a terminal support zone — especially under extreme external pressure — is among the strongest evidence that selling exhaustion has been reached.
Dimension Scorecard
Dimension Breakdown
Qualitative Analysis
Primary Count (65%): WXY Correction Completing
Bitcoin is tracing a complex WXY corrective pattern from the October 2025 ATH:
- Wave (W): $128K → $78K — five-wave impulse down
- Wave (X): $78K → $105K — three-wave relief rally (0.618 retracement)
- Wave (Y): $105K → $60-63K — five-wave decline to lower channel boundary
Wave (Y) appears to be in its terminal phase. Price has reached the lower boundary of the descending channel, the 0.883 Fibonacci retracement, and a zone of prior structural support. The failure to make a new low during the Iran-US shock is consistent with wave (Y) exhaustion.
If correct, the next move is a sustained rally — potentially back to the $80-100K range as the first impulsive wave off the corrective low.
Invalidation: Weekly close below $60,000.
Alternative Count (35%): Wave (Y) Extension
The Feb 25 low at $60,187 was not the terminal point but an internal wave within a larger (Y) decline. The weekend bounce to $68,200 would be corrective within (Y), and another leg down to $53-55K follows. This count gains probability if ETF flows reverse, oil spikes above $100, or US equities open sharply lower.
- $80,700 — SuperTrend sell trigger (trend reversal confirmation)
- $72,600 — 200-day EMA (major overhead resistance)
- $70,000 — Psychological round number
- $68,200 — Weekend high (Khamenei-news spike)
- $63,068 — Weekend low (must hold for higher-low thesis)
- $60,187 — Feb cycle low (the line in the sand)
- $55,000 — Channel extension (next support if $60K breaks)
- $53,000 — Deep Fibonacci (0.786 retracement of entire bull run)
The framework produces a red signal (38). The structural overlay suggests a potential corrective terminus. These two readings are in tension.
Resolution: We do not trade the anticipation of a bottom. We trade the confirmation.
What confirmation looks like:
- Weekly close above $70,000
- ETF flows remain positive — at least 3 consecutive inflow days in first week of March
- No new low on any retest — the $60,187-$63,068 zone must hold
- Stochastic crossover confirmed — momentum flips from red to yellow
Until then: No position. The risk-reward of front-running a potential bottom in a hostile regime environment is unfavorable.
For existing holders: The structural evidence at this support zone — channel boundary, Fibonacci confluence, no new low on a war shock, extreme fear readings, ETF inflow resumption — argues against panic selling here. This is not the zone to capitulate.
If confirmation appears: Initial target $80,000-$85,000 (channel midline). Extended target $95,000-$105,000 (wave X high and 200WMA convergence). Stop: weekly close below $60,000.
If invalidation triggers ($60K break): Expect acceleration toward $53-55K. Do not catch the falling knife. Reassess at the deep Fibonacci cluster.
What could go right:
- Khamenei's death leads to regime destabilization → faster de-escalation → risk-on rally
- ETF inflows accelerate — institutional money treats $60-66K as accumulation zone
- Fed signals rate cuts in response to tightening financial conditions
- The corrective WXY pattern completes and a new impulse wave begins
What could go wrong:
- Iran-US conflict escalates → Strait of Hormuz blockade → oil above $100 → inflation spike
- US equities open sharply lower on Monday → BTC follows as high-beta macro asset
- ETF flows reverse — the late-Feb inflow burst was tactical, not structural
- $60,000 breaks → cascading liquidations, $53K then $48K
Key catalysts this week:
- Monday March 3: US equity market open — first real liquidity test since the strikes
- Monday March 3: Spot Bitcoin ETF flow data — the single most important number
- All week: Iran-US diplomatic/military developments — UN Security Council in emergency session
- All week: Oil price → Strait of Hormuz status → inflation expectations chain
Risk Assessment: The asymmetry at this structural level favors patience over action. If the corrective pattern is completing, there will be ample opportunity to enter on confirmation. The cost of waiting for confirmation is minor; the cost of being wrong at a potential false bottom is significant.
The signal is red. The structure is potentially turning. The war didn't break the pattern.
We publish the numbers. You make the decision.